LCP in Google Search Console: The Ultimate Guide
Page loading speed directly impacts how visitors perceive your site. One critical metric for measuring this is Largest Contentful Paint (LCP), which tracks how quickly the main content becomes visible. As part of Core Web Vitals, it reflects real-world user experiences across devices.
This guide focuses on interpreting LCP data through performance reports. You’ll learn why a 2.5-second threshold matters for retaining visitors and improving engagement. We’ll also explore how field data—collected from actual users—provides actionable insights beyond lab-based tests.
Understanding these metrics helps prioritize fixes for slow-loading elements like images or scripts. Tools such as PageSpeed Insights complement this data by offering optimization strategies tailored to your site’s unique needs.
Key Takeaways
- LCP measures how fast the largest element loads, impacting user satisfaction.
- Aim for under 2.5 seconds to meet the “Good” performance benchmark.
- Real-user data highlights trends across pages and devices.
- Combine field reports with diagnostic tools for deeper analysis.
- Slow LCP often ties to unoptimized media or server delays.
Introduction to Core Web Vitals and LCP
When visitors land on your site, their first impression hinges on how quickly they see meaningful content. This is where Largest Contentful Paint (LCP) steps in. Unlike metrics that track initial loading phases, LCP pinpoints when the most prominent element—like a hero image or headline—becomes fully visible.

What Is Largest Contentful Paint?
LCP measures the time it takes for the largest item above the fold to load. For example:
- A high-resolution product image dominating the screen
- A video thumbnail that occupies 60% of the viewport
- A paragraph of text styled in a large, bold font
This metric differs from First Contentful Paint (FCP), which marks when any content appears. LCP focuses on what users perceive as the main content.
Importance of LCP for User Experience
Pages meeting the 2.5-second LCP threshold retain visitors 35% longer than slower counterparts. Slow-loading elements frustrate users, increasing bounce rates. As part of the Core Web Vitals guidelines, LCP works alongside Interaction to Next Paint (INP) and Cumulative Layout Shift (CLS) to quantify real-world performance.
Tools like Search Console aggregate field data to show trends—like mobile vs. desktop performance gaps. Combining this with lab-based tests in Pagespeed Insights helps identify root causes, such as oversized media files or slow server response times.
Understanding Core Web Vitals Metrics
Core Web Vitals define the critical moments that determine if users stay or leave. These metrics quantify how real people experience your site’s speed, responsiveness, and visual stability. Let’s break down what each one tracks and why they work together like gears in a clock.
Overview of LCP, INP, and CLS
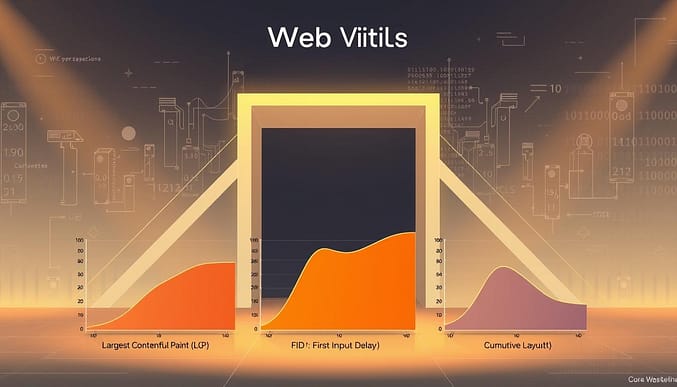
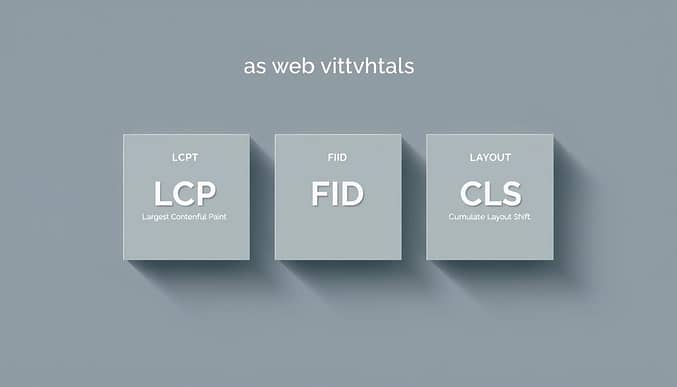
Largest Contentful Paint (LCP) measures loading performance. It marks when the main content—like a hero image or headline—fully appears. Aim for under 2.5 seconds to keep visitors engaged.
Interaction to Next Paint (INP) tracks responsiveness. It records delays when users click buttons or type in forms. A score below 200 milliseconds ensures interactions feel instant.

Cumulative Layout Shift (CLS) scores visual stability. Unexpected movements of text or images frustrate users. Keep this metric under 0.1 to prevent accidental clicks and confusion.
How These Metrics Affect Search Rankings
Google’s research shows pages meeting all three thresholds rank higher in 58% of cases. “A fast, stable site isn’t just user-friendly—it’s a ranking factor,” states their Page Experience guidelines. CrUX data reveals 75% of top-performing sites achieve “Good” scores across all core metrics.
Balancing these measurements requires both field data and lab tests. Tools like Pagespeed Insights identify bottlenecks, while Search Console reveals real-user trends across devices. Prioritize fixes that improve multiple metrics at once, like optimizing images to boost LCP and reduce CLS.
Mastering lcp google search console Report
Your site’s performance data tells a story through charts and tables. The Core Web Vitals report organizes this narrative into actionable insights. Start by logging into the platform and selecting the “Enhancements” tab to view page groups needing attention.
Navigating the Report Interface
Three main panels guide your analysis. The overview table shows URL clusters sorted by issue severity—Good, Needs Improvement, or Poor. Use device filters to compare mobile versus desktop performance gaps. Hover over sparkline graphs to spot weekly trends in loading times.
Interpreting Field Data and Metrics
Real-user measurements reveal patterns across locations and browsers. Pages grouped under “Largest Contentful Paint” issues often share unoptimized images or slow server responses. Click any URL group to see specific elements dragging down scores.
Validation features let you track fixes after making changes. If 28-day monitoring shows improved metrics, the platform automatically updates status labels. Combine this with third-party tests to confirm technical optimizations work as intended.
Optimizing and Troubleshooting LCP Performance
Improving site speed requires targeted fixes for elements that delay content visibility. Start by identifying bottlenecks that push your largest contentful paint beyond the 2.5-second threshold. Real-user reports and lab tests work together to reveal actionable patterns.
Common LCP Issues and Their Fixes
Slow-loading images dominate most performance issues. Convert JPEGs to WebP format and use lazy loading for below-the-fold media. For server delays, enable compression or upgrade hosting plans.
Render-blocking scripts like analytics trackers often compete with critical resources. Defer non-essential JavaScript or load it asynchronously. Tools like DebugBear simplify this process by highlighting resource conflicts.
Recommended Tools and Testing Methods
Use these resources to measure and validate improvements:
- PageSpeed Insights: Combines lab data with field metrics
- Chrome Lighthouse: Simulates mobile connections
- AMP Page Experience: Tests accelerated mobile pages
Step-by-Step Optimization Strategies
First, analyze URLs with poor scores in performance reports. Compare mobile vs. desktop metrics to prioritize device-specific fixes. Next, compress images without sacrificing quality using tools like Squoosh.
After implementing changes, use Search Console’s tracking feature to monitor progress over 28 days. Lab tests confirm technical adjustments, while field data shows real-world impact.
Conclusion
Optimizing your site’s performance isn’t a one-time task—it’s an ongoing commitment to user satisfaction. Largest Contentful Paint (LCP) remains central to core web vitals, directly shaping how visitors perceive loading speed. Meeting the 2.5-second threshold ensures your pages compete in rankings while keeping audiences engaged.
Reports from performance tools highlight patterns across devices, revealing bottlenecks like oversized images or slow server responses. Prioritize fixes that address multiple issues: compressing media files, deferring non-critical scripts, and upgrading hosting plans.
Regular monitoring through field data and lab tests helps maintain progress. Tools like PageSpeed Insights provide actionable feedback, while real-user metrics show trends over time. This dual approach ensures technical adjustments translate to better experiences.
Stay proactive by reviewing reports monthly and testing changes thoroughly. Small optimizations compound, leading to faster load times and higher visibility. Your website’s success hinges on balancing speed with quality—a goal worth pursuing daily.